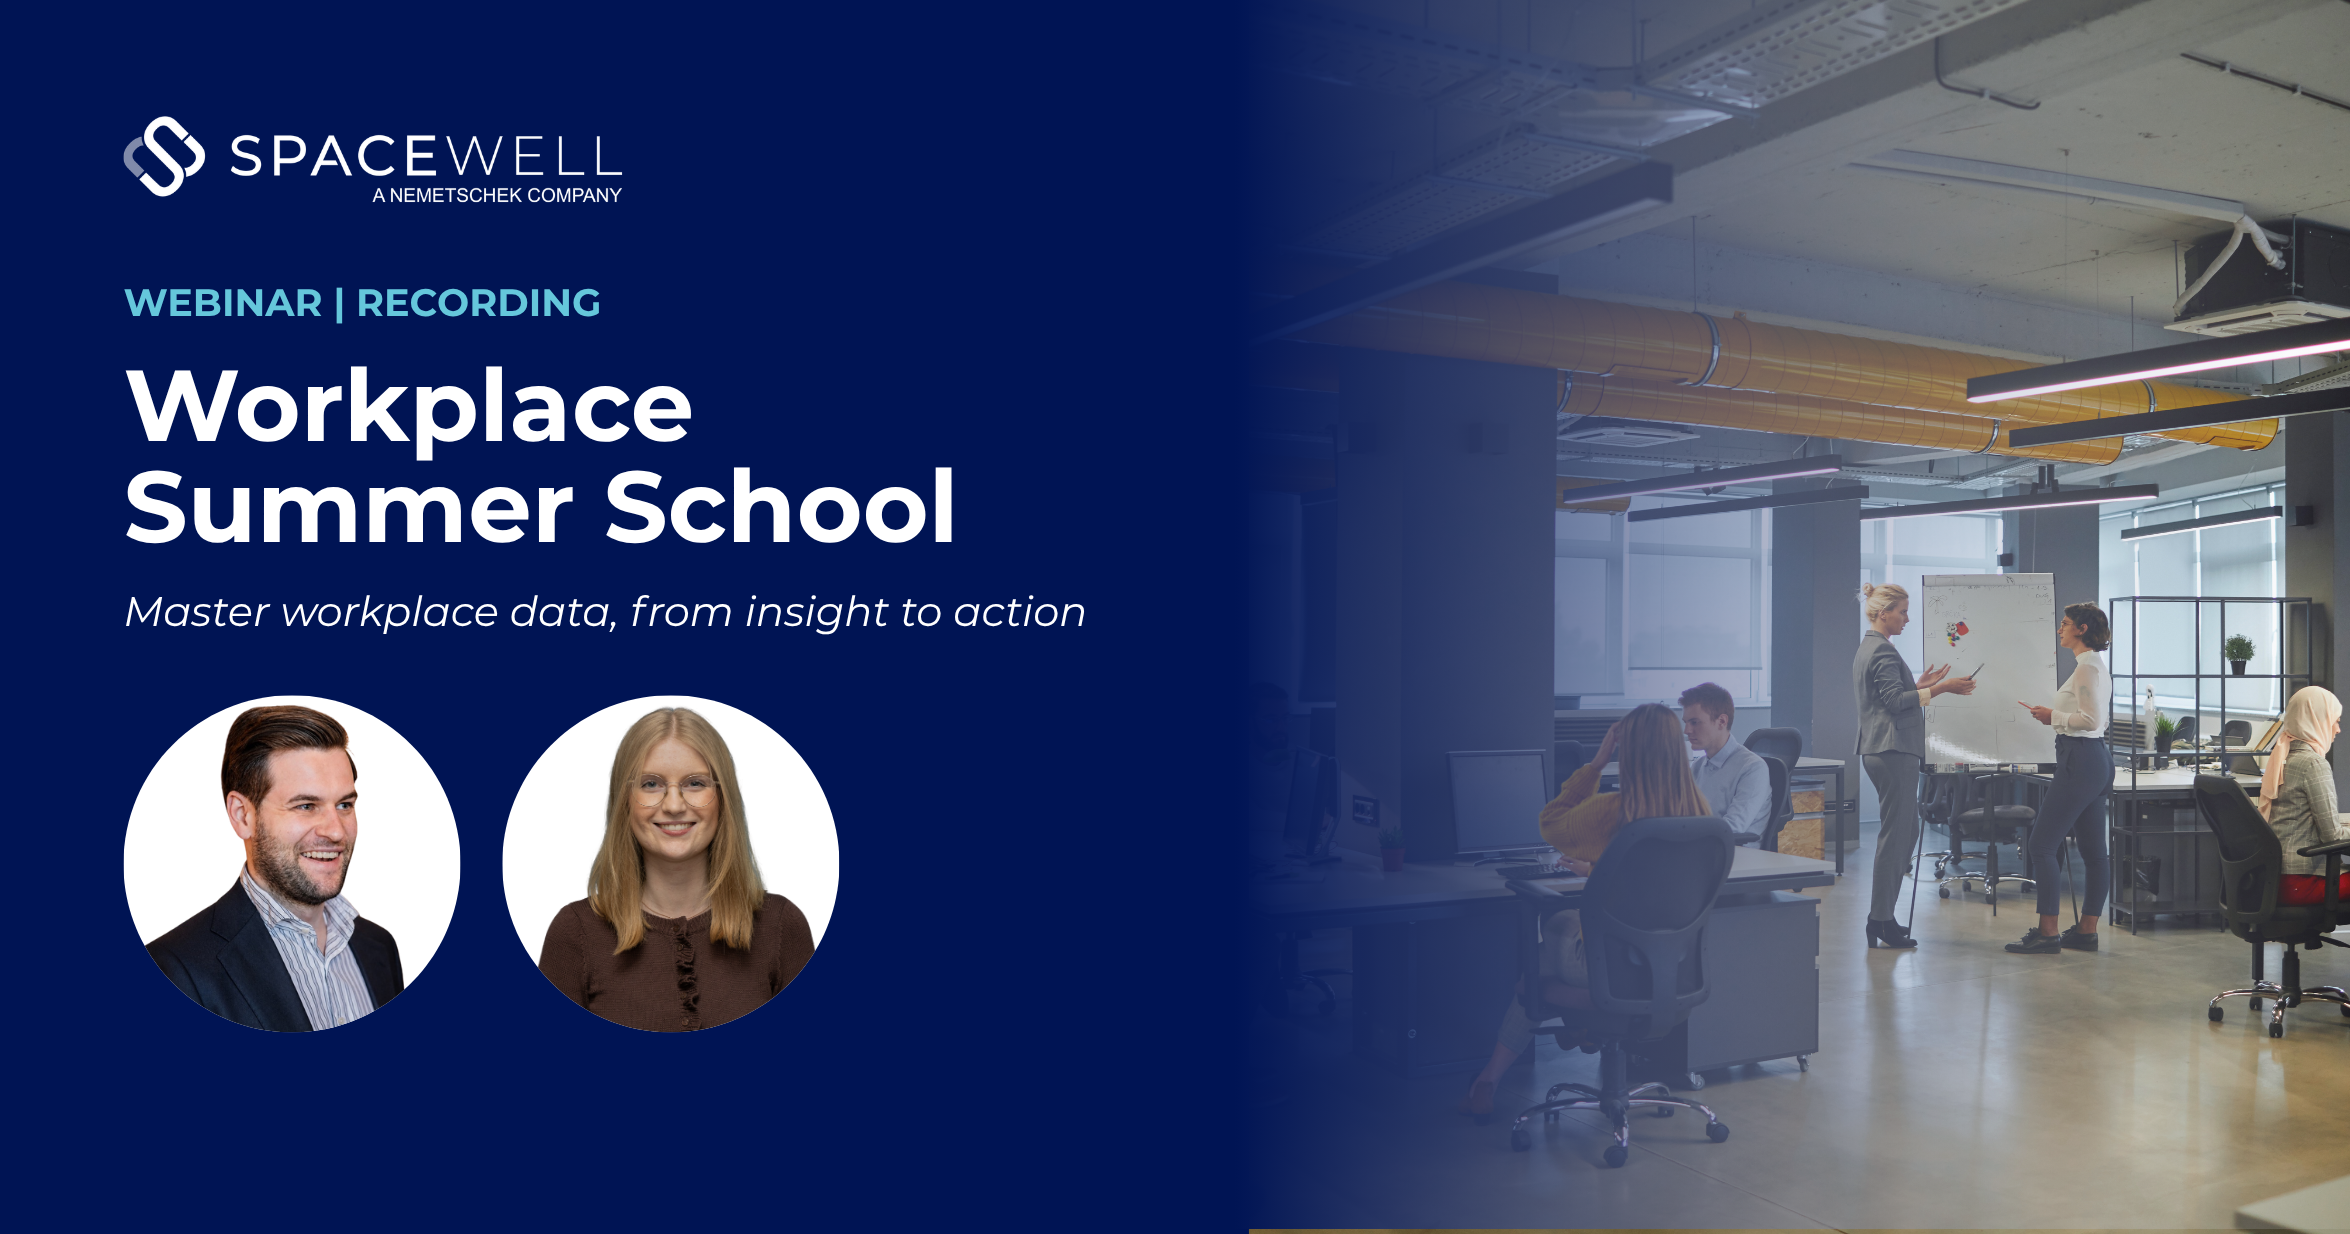
The Spacewell Workplace Summer School has finished, but you can still watch all four sessions on demand. Led by Franziska Weiß and Remon Gebel, the series explores how real office occupancy data and Spacewell dashboards can support smarter workspace decisions.
Through practical examples, you’ll discover what’s new in Spacewell Workplace dashboards, how to turn data from your own workspace into useful insights, and where deeper training with our experts can help your organisation get even more value from Spacewell.
What you’ll learn
Explore the new generation of Space Occupancy Dashboards. This short session takes you straight into the dashboards, focusing on the Summary Page as a powerful entry point into your occupancy data. You’ll see how hourly, weekly and monthly views work together to reveal patterns in office use, from daily peak times to longer-term trends, and learn where to look first when exploring your own data. Learn about the difference between the dashboards, the metrics, sharp filtering, and customisable color-coded targets for occupancy and utilisation.
Key Takeaway: One glance at the Summary Page already gave a lot of insights how office space were being used.
This session focuses on Occupancy Analysis, from building to floor level, as well as per space. You will discover the estimated headcount metric, and see the powerful new heatmap in action to visualise where your office spaces are truly busy or underused. These different views offer much more granularity than simple averages to understand how space is really used, revealing utilisation patterns and underused areas.
Key Takeway: More detailed occupancy and utilization patterns emerged when looking beyond the average: down to building, floor, and single-space level.
Discover the brand-new Space Efficiency Dashboard, which connects headcount data from sensors with room capacity to reveal not just whether a space is used, but how well. Charts like the efficiency-versus-utilization matrix uncover performance profiles across the portfolio. Learn how headcount data and room capacity combine to unlock better use of your existing office space.
Key Takeaway: An occupied space wasn’t automatically an efficient space. The efficiency data showed the difference.
Take a closer look at the Space Simulator, which allows you to test capacity, savings, and benchmarking scenarios of your workplace before taking decisions. You’ll see how adjustable paramerters like clear desk policy, vacancy buffer, risk factor and manual inputs make simulations flexible and realistic.
Explore three types of simulations:
- Savings Simulation – how much space and cost you could reduce
- Capacity Simulation – how many people you can add or how much space you need
- Benchmarking – how one building compares to others on occupancy and utilisation
Key Takeway: Insted of guessing the next space decision, participants learned how to simulate it first.
Our experts

Franziska Weiß
Implementation Consultant
Franziska focuses on in implementing data-driven workplace solutions and analyzing space management data that support organization’s decision making.

Remon Gebel
Implementation Consultant
Remon has extensive experience helping organizations with their facility questions and data-driven workplace solutions that support their decision making.
Get the recordings
Missed the live sessions? No problem. Complete the form below and we’ll send you the links to all four recordings, so you can watch whenever it suits you.