Energy teams today are rich in data but often lack an efficient way to derive comparable, actionable insight across meters, buildings and time periods. The latest Spacewell Energy release focuses on two core capabilities: better comparability in analytics and more targeted anomaly management, so energy managers can spend less time wrestling with charts and more time driving savings and decarbonisation.
Clearer comparisons with axis scaling in Analytics
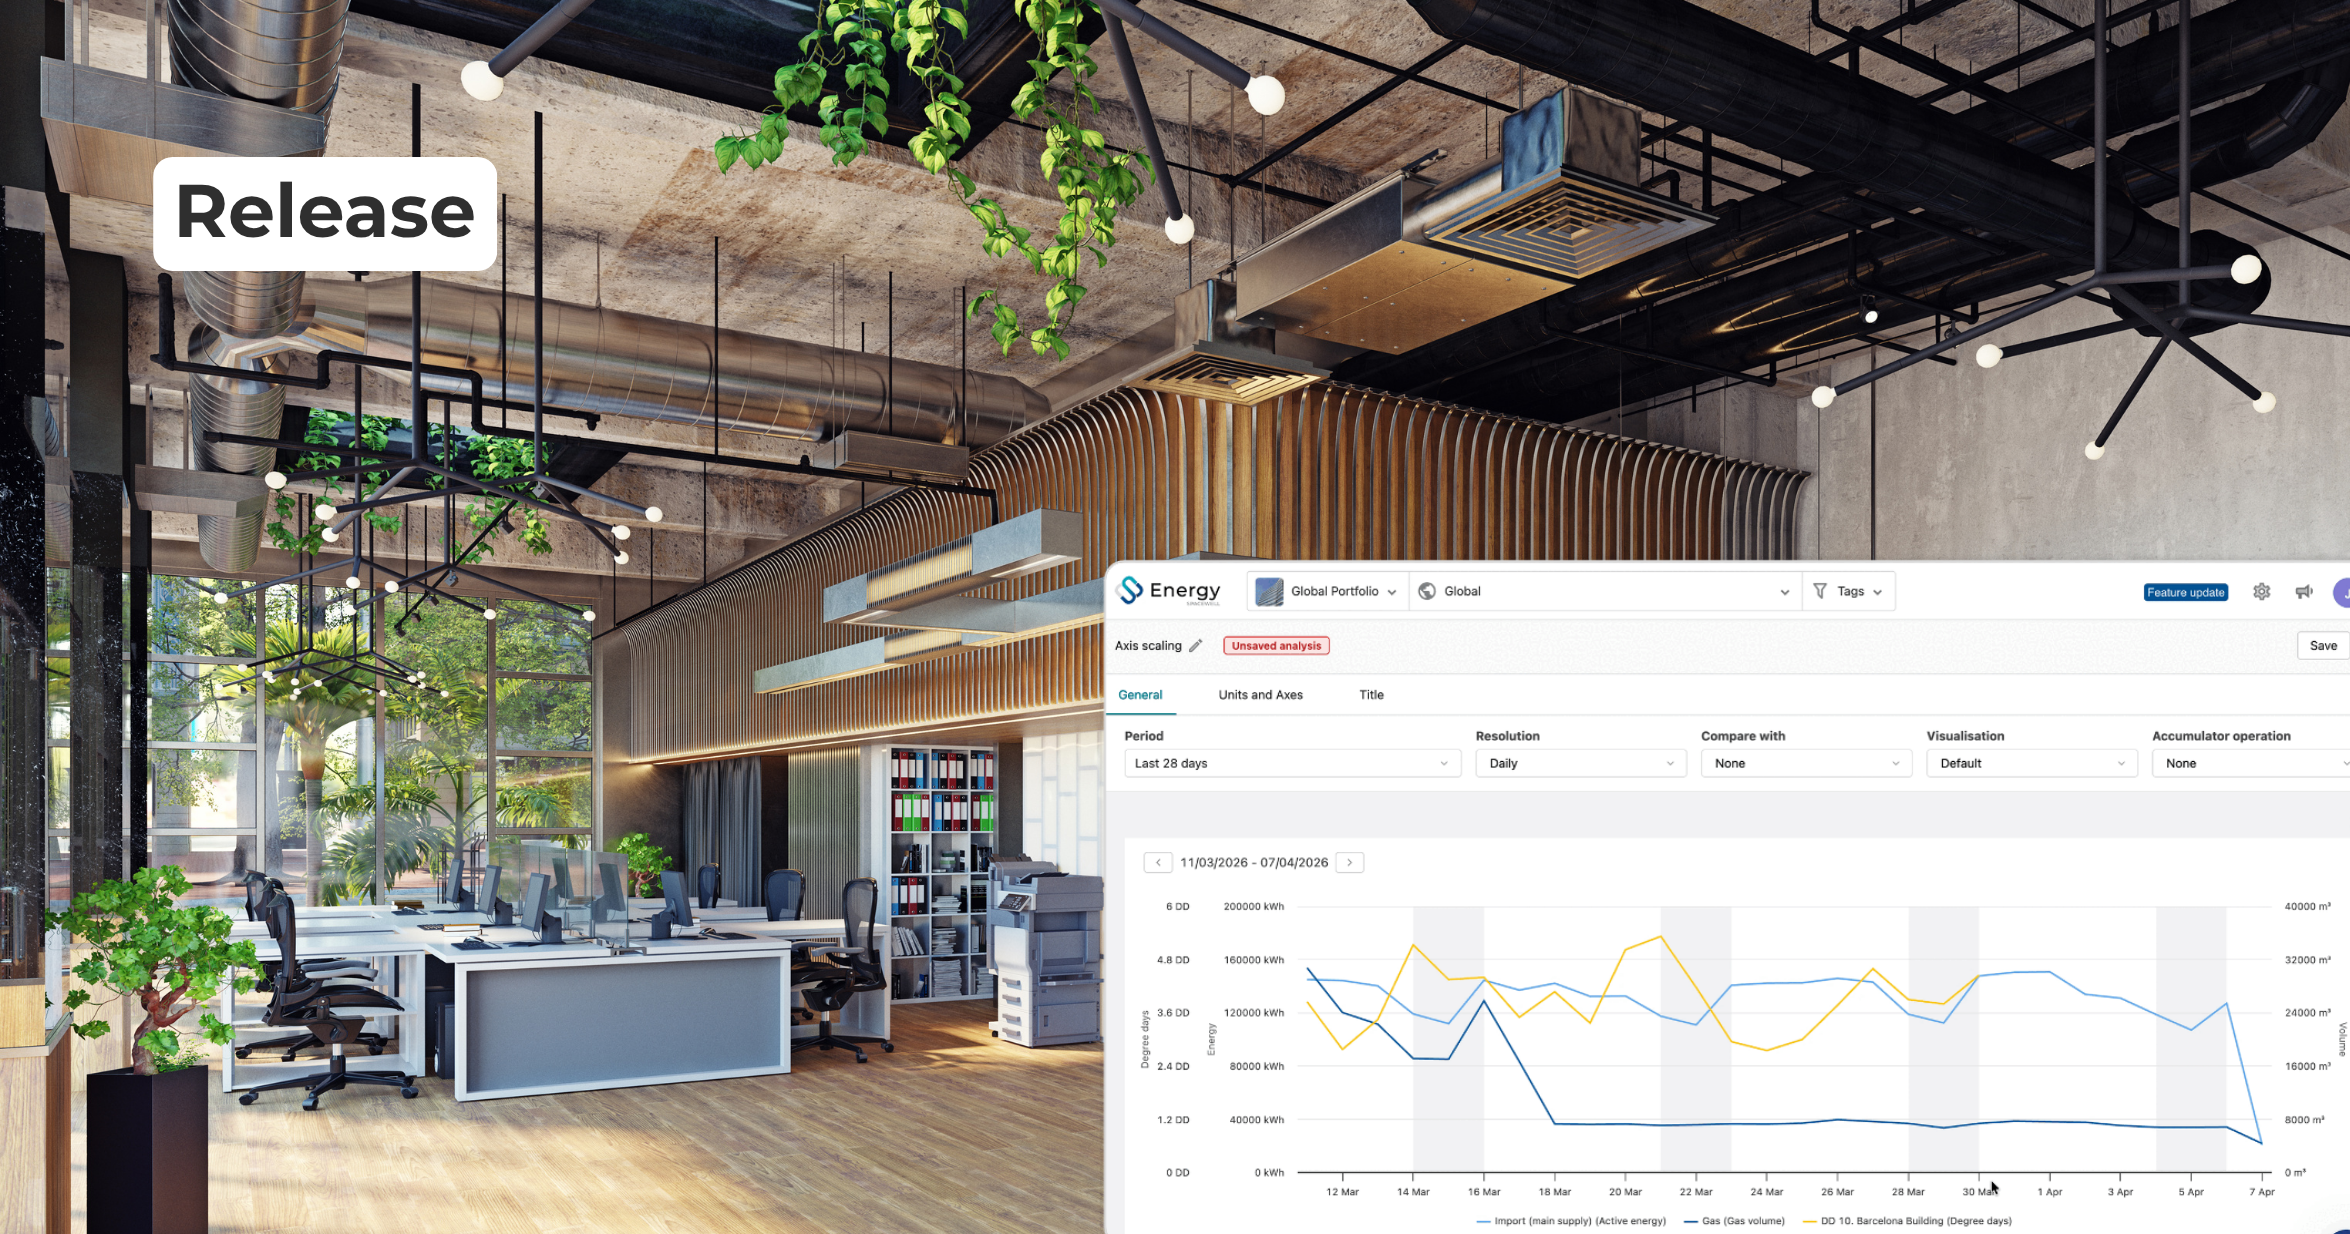
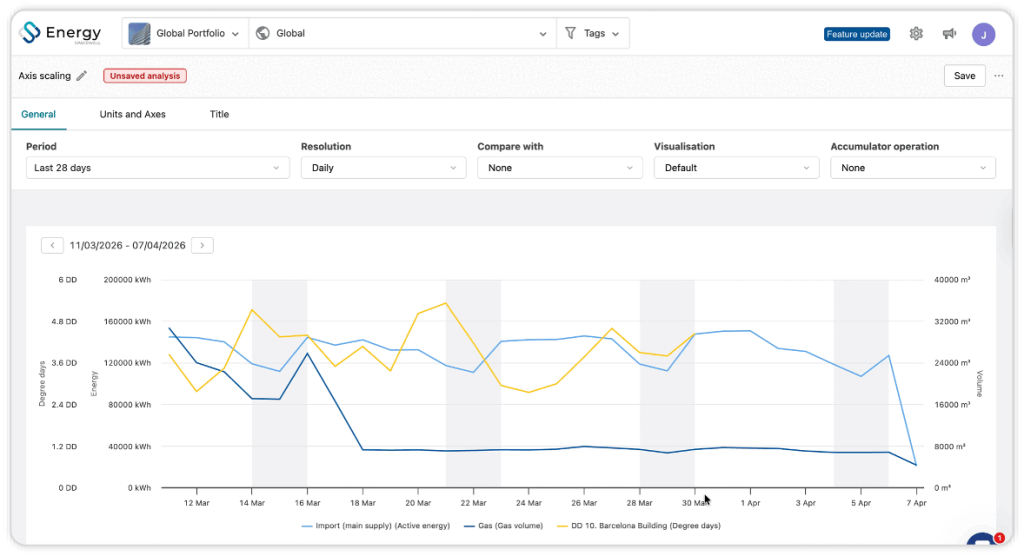
In many portfolios, energy dashboards combine electricity, gas, heat and other metrics on a single chart. Without flexible axis control, smaller signals are flattened and meaningful trends are obscured. The new axis scaling feature in Analytics addresses this directly.
Users can now:
- Set minimum and maximum values per axis to match the relevant range for a given analysis.
- Compare different units and data series within a single chart without losing visibility on lower‑magnitude lines.
- Quickly adjust scaling when switching between high‑consumption assets and smaller sub‑meters.
Technically, axis scaling is applied at the chart configuration level, so settings persist across sessions and can be standardised for shared dashboards. For multi‑site portfolios, this means a single analytics view can be tuned once and reliably reused across buildings and teams, maintaining a consistent visual language for internal reporting.
Focusing on high‑impact anomalies
Traditional anomaly lists often create alert fatigue: hundreds of deviations are flagged without context, leaving energy managers to manually triage what matters. The new grouping and filtering options in Spacewell Energy’s anomaly detection module are designed to reduce this noise.
Users can now:
- Group anomalies across time, locations and devices to easily detect when and where most anomalies occur.
- Filter anomalies by configurable criteria (e.g. parameter (energy source), severity, duration, starting hour, cost, reliability, day of the week, status) severity to isolate the issues with the greatest operational or financial impact.
- Use multi‑dimensional combinations (for example, “all anomalies in Building A during weekend nights, grouped by device”) to directly answer questions that previously required custom analysis.
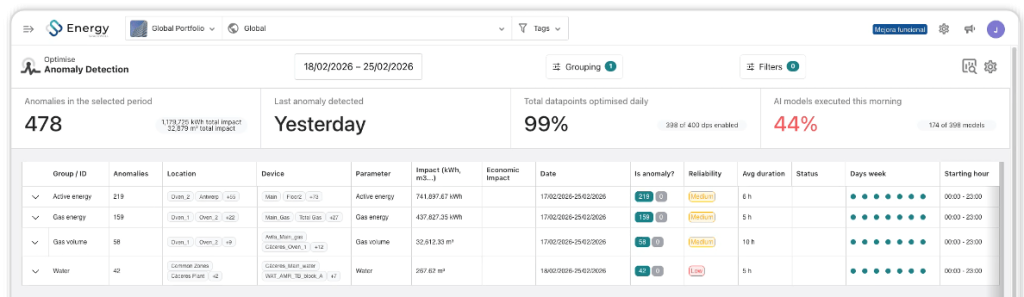
From a system perspective, anomalies remain stored as discrete events, but the UI layer now supports dynamic aggregation and filtering, ensuring the underlying data model is robust enough for integrations and historical analysis. For organisations pursuing ISO 50001 or similar standards, this provides a more auditable path from anomaly detection to remediation.
From visibility to energy optimisation
Together, these updates make it easier for energy teams to analyse complex data with more clarity and less noise. Axis scaling helps users compare different data series in a more readable way, while anomaly grouping and filtering help them focus on the deviations with the greatest operational impact. The result is a more practical analysis experience, where users can move faster from identifying unusual behaviour to understanding where action may be needed.
Already a customer? You can already find these updates in your account.
Not a customer yet? We invite you to request a demo to see how Spacewell can fit in your efficiency strategies.