
Energy management runs on trustworthy data and the time to actually act on them. This release focuses on both: reports get noticeably faster to build, baseline modelling moves fully into the core platform with a way to check whether you can trust it, and locations gain the detailed building context good analysis depends on.
Build reports faster with Business Insights
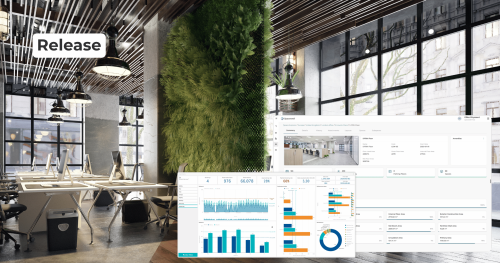
Creating an energy report used to mean manually assembling the right tables and figures every time. Business Insights changes that with ready to use report blocks that automatically adapt to whichever location, period, and language you select. Available blocks currently cover contract information, cost breakdowns, and daily consumption cost, and they combine freely with existing widgets to build richer templates.
Energy managers, consultants, and service providers can now create reports faster using purpose-built Business Insights blocks, with less manual configuration and more flexibility to tailor each report to their needs.
Baseline modelling becomes native, with a trust check
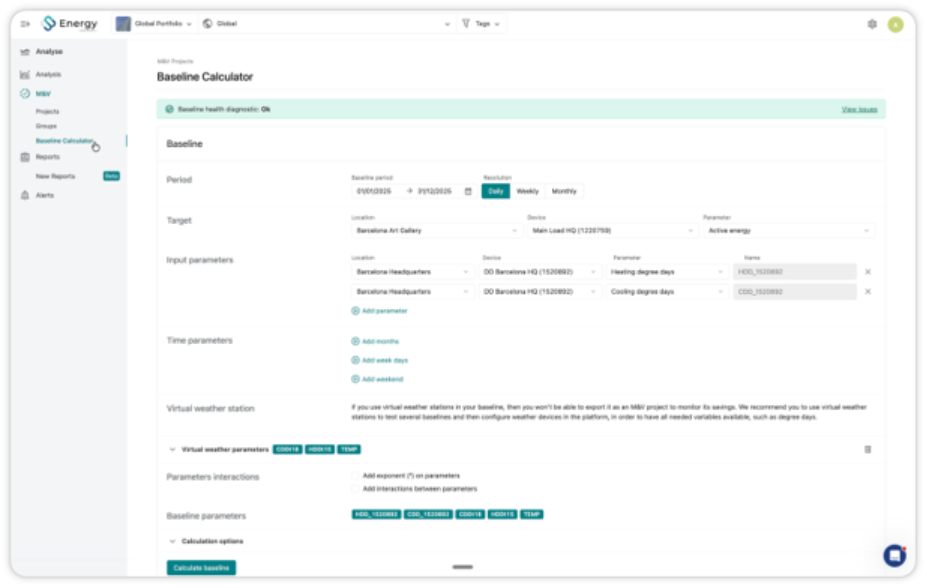
The Baseline Calculator has moved out of the Apps Market and into the core Energy platform for eligible licenses, accessible directly from the main menu with no separate installation. Alongside the move comes something genuinely new: Baseline Health Diagnostics. Every baseline now runs through eleven statistical checks covering data availability, model significance, multicollinearity, and linearity, distilled into a clear OK, Warning, or Critical status. Rather than leaving you to interpret raw statistical output, the diagnostics explain what might be compromising a model and offer specific recommendations for improving it.
Richer building information for every location
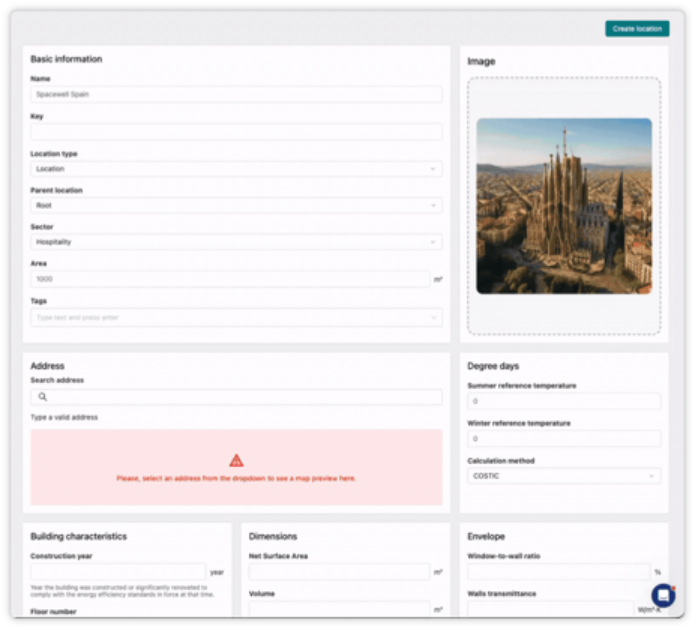
The Location Information page has been substantially expanded, now including smart address search and validation through an interactive map, building dimensions, envelope data, and category specific metadata for systems like solar PV and CHP.
Certifications are properly supported too, with dedicated fields for EPC, NABERS, BREEAM, LEED, and WELL. Everything is organized into structured sections rather than one long form, which makes a real difference once you are managing a large portfolio across many buildings and countries.
Locally relevant weather data for Germany
Energy managers working in Germany or the wider DACH region now have access to degree day calculations based on the VDI 20/15 method, a standard specific to that market. This lets consumption data be normalized using weather indicators that are actually recognized in German market practice, rather than a generic international method that might not hold up to local scrutiny.
Updating prices at scale through the API
A new API endpoint lets you update prices within an existing electricity price configuration. For integrators and consultants managing large numbers of tariffs, this makes it possible to apply price changes at scale without editing each configuration manually, reducing effort and the risk of errors.
What this means for you
This release tightens the foundations good energy analysis depends on: faster reporting, baseline models you can actually trust, richer building context, and data maintenance that scales with your portfolio. None of it is flashy, but together it makes the everyday work of an energy manager noticeably lighter.
Not a Spacewell customer yet? Fill out the form below and let our team guide you through the first steps toward a smarter, more connected workplace.